Ball possession, formations and expected goals against – a statistical review of team performances in the League of Ireland

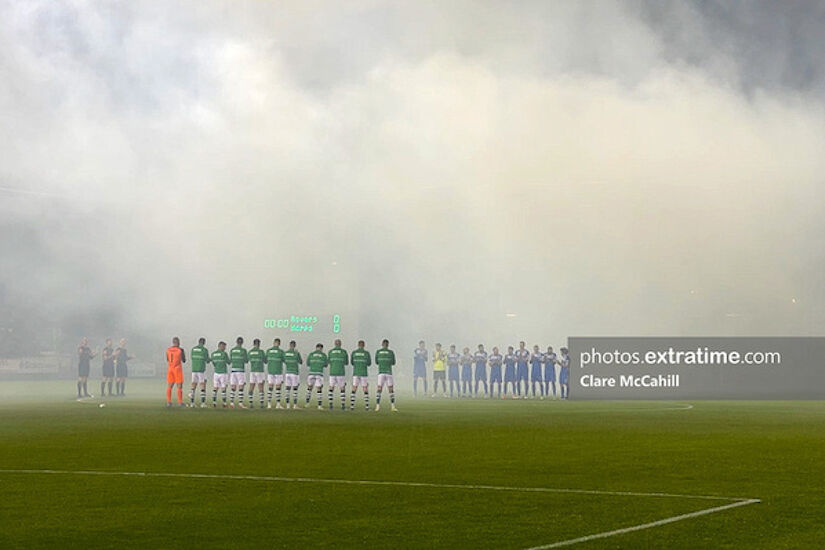
Tallaght Stadium Credit: Clare McCahill (ETPhotos)
Having reviewed the best individual player performances in the Premier Division for this season earlier in the week (see here), we now take a look at what match analysis platform Wyscout had to say about team performances in the top flight of the League of Ireland in 2021.
Average passes and ball possession
The average number of passes per 90 minutes in the league was 353 with a 77% completion rate. Shamrock Rovers made the most passes in the Premier Division averaging 487 per 90 minutes with a 83% pass completion rate, ahead of St. Patrick’s Athletic (421 with 80% completion rate) and Dundalk 401 (79%).
Meanwhile, the bottom three in passing terms were Longford Town (280 and 71%), Waterford (268 and 73%) and Finn Harps (261 and 70%).
Shamrock Rovers topped the ball possession chart with 61%. St. Patrick’s Athletic were second on 56% just ahead of Dundalk (55%). Harps, Waterford and Longford all only had 42% of the ball on average in their games.
Formation
The formation of choice this season was 4-2-3-1. Eight clubs used that set up the most with three clubs playing that way for more than half of the time - Sligo (61%), Longford (56%) and Dundalk (55%). Bohs (48%), Waterford (37%), Harps (36%), St. Pat's (24%) and Derry (23%) used it as their most preferred formation but with lessening regularity.
Shamrock Rovers used a 3-4-2-1 formation 66.5% of the time while it was also Drogheda’s most used formation even if they only used for 20% of the time – they went 4-2-3-1 for 18% of games.
Discipline
Drogheda United, Dundalk and Longford Town all averaged ten fouls per 90 minutes. Harps had the most yellow cards 86 – compared with 66 on average across the top flight – just ahead of Waterford on 85 with Pat’s and Derry joint third back on 69.
Crosses and dribbles
Dundalk topped the crossing charts with 20 per 90 minutes with a 36% completion rate – compared with the league average of 14 and 30%. St. Pat’s had 17 per game with 27% completion rate but Bohs had a much higher completion rate (35%) off their 16 crosses per 90 minutes.
With crosses being the end product of many dribbles, it isn’t a surprise to see Bohs top the dribble charts with 33 per game with Dundalk just behind them on 30 dribbles per game.
Expected goals* (for and against)
Shamrock Rovers slightly overperformed looking at how many goals they scored (59) compared with their xG of 56. It was similar for St. Patrick’s Athletic (56 scored off 49 xG). Bohs slightly underperformed (59 scored from an xG of 62) while Dundalk significantly underperformed scoring 44 goals off an xG of 56.
Looking at expected goals against, Sligo Rovers conceded 32 goals off an xG against of 39 while St. Pat’s conceded 42 goals from an xG against of 36.
*Wyscout defines expected goals as a metric that assigns to every shot a probability (based on historical stats) of how likely it is to score from the position, type of assist, preceding events etc. A modern metric that allows to study the results of the matches with more stress on predictability of moments creation and less on pure luck.
Passes per defensive action (PPDA)**
We will round off our team review with the nerdtastic PPDA. Shamrock Rovers topped this one with a 7.8 score, followed by Bohemians (8.2) and Sligo Rovers (8.3)
**Opponent passes per defensive action in opponent's final 60% of the pitch. A well- studied metric used to qualify pressing intensity.
The nerds have their statistical say on LOI team of the year https://t.co/uDhTteaocepic.twitter.com/6mCDlWxmxc
— Extratime.com (@ExtratimeNews) December 6, 2021

